Includes new radial bar chart, data sorting, plus marker clusters for scatter and map point series.
Features
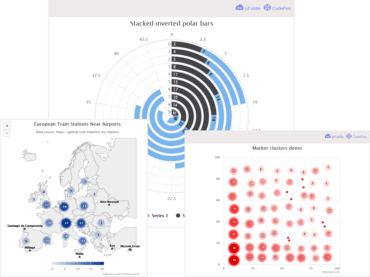
- New in Highcharts v8.0.0
- Added new series type, radial bar chart. Under the hood, this is a column series in an inverted and polar chart.
- Added data sorting with animations on update.
- Added marker clusters for scatter point series.
- Added new option accessibility.linkedDescription.
- Added new accessibility options with more flexibility for customizing the hidden screen reader regions.
- Added flame chart demo.
- New in Highstock v8.0.0
- Added Slow Stochastic indicator.
- New in Highmaps v8.0.0
- Added marker clusters for map point series.
Fixes
- Fixes in Highcharts v8.0.0
- Fixed #12053 and #12152, pattern fill issues. Introduced
color.patternIndexoption. - Fixed #7255, trying to printing chart again, after cancelling in Safari, elements other than chart were not hidden.
- Fixed #12488, selection zoomed to wrong area in the Treemap series.
- Fixed issue with wrong extremes for bubble series when xAxis.max set.
- Fixed #12549, disabling keyboard nav still added container
tabindex. - Fixed #12438, a regression causing the reset zoom button not to work with the a11y module on mobile.
- Fixed #12462, filename with forward slash (/) not being replaced with safe character when exported. Now replaced with -.
- Fixed issue with data labels visible despite point placed outside the plot area, see #12370.
- Fixed #12343,
noDatamessage was not visible with gauge series. Added 1 as defaultzIndexto render the message in front. - Fixed #12500, updating
dataLabelcolor from contrast to a different one was not working. - Fixed #12459, annotation's control points were not draggable.
- Fixed #12425, updating sunburst series used to disable traversing.
- Fixed compatibility issues with menu navigation for screen readers.
- Fixed #12161, legend
textDecorationhidden style not working on IE11 with accessibility module enabled. - Improved handling of null point accessibility.
- Fixed #12090, a11y module broke legend navigation.
- Fixed minor bugs with keyboard navigation.
- Fixed #12434 and #12097, regression in venn series label positioning causing JavaScript error.
- Fixed #12445, updating
borderColorandborderWidthdidn't work for solid gauge series. - Fixed #12421, high contrast mode used to throw errors when the
colorAxismodule was not loaded. - Fixed #12390, not overlapping dataLabels after zoom in and zoom out were hidden.
- Fixed #12262, Sunburst did not use 100% of the plot area.
- Fixed #12374, sankey nodes were rearranged after redraw where the nodes.level option was used.
- Fixed #12295,
nullwas used as event listener in drilldown module, which caused a JavaScript error when called. - Fixed #12335, memory leaks in polar series after updating data set.
- Fixed #12333, setting data in treemap series with points with the same ID's did not render new points.
- Fixed #12289, sonification timeline issues with multiple charts.
- Fixed #11617, support tooltip.split with
chart.scrollablePlotArea. - Fixed #12267, error in waterfall chart when the series was invisible and the first value was below 0.
- Fixed #12248, the Y axis' range was disturbed on stacked (overlapping) waterfall chart.
- Fixed #11758,
stackLabelsin styled mode used to throw errors.
- Fixed #12053 and #12152, pattern fill issues. Introduced
- Fixes in Highstock v8.0.0
- Fixed regression which prevented from panning to the left side when
dataGroupingandxAxis.ordinalwere enabled. - Fixed #12216, Stock Tools UX was not working optimal on mobile devices.
- Fixed #12145, missing option
supertrend.color. - Fixed #12298, enabling crosshair label while a point was hovered rendered crosshair labels for all axes.
- Fixed regression which prevented from panning to the left side when
- Fixes in Highcharts Gantt v8.0.0
- Fixed #11427, in certain date ranges, single years were displayed on both rows in the grid axis.
- Fixed #10324, regression with
xAxis.grid.cellHeight.