Add Radar charts to your JavaScript apps.
Features
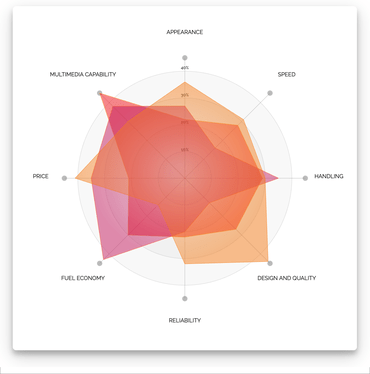
Vizuly Radar Chart graphs multiple dimensions of one datum along multiple radial axis. Each plot represents 3 or more data points along shared axis lines. This chart supports highlighting of both individual data points and the group as a whole.
Features
- Supports Vertex Point and Group Highlighting
- Angular or Curve Line Types
- 6 example themes
- More than a dozen dynamic styles
- Dozens of adjustable properties and interactive event support
- Customizable Data Tips
- Documentation
Framework Adapters
- React Adapters
- Angular Adapters
- Vue.js Adapters