Adds Sankey flow diagrams that show linked nodes, the quantity of each flow being represented by its width.
Features
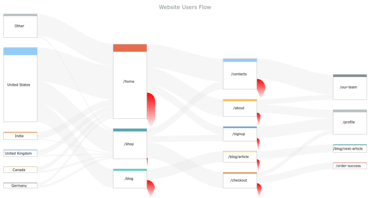
- Sankey Diagram - A Sankey diagram is a flow diagram that shows nodes linked by flows, the quantity of each flow being represented as its width. This chart type emphasizes the major transfers or flows within a system and helps to locate dominant contributions to an overall flow.
- Significantly improved performance.
- Improved rendering of legends.
- Axes line markers can now dispatch mouse events.
- Now the fill of 3D Pie charts can be transparent.
- Added contextMenu() method to the anychart.ui.table class.
- Now a gradient fill can be set as a string.