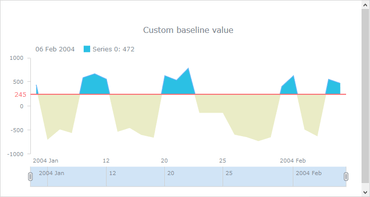
Adds several new ways to customize the coloring of chart series.
Features
- HTML Tooltips Support - Tooltip customization is way easier now. Full support of HTML is available and you can write your own HTML code and customize tooltip visualization using CSS classes.
- Background Settings for Chart Data Bounds - The background can now be changed in the data area if needed.
- Coloring Rules and Thresholds - New ways to customize the coloring of series have been added including negative/positive colors, rising/falling colors, and the ability to specify the Color Scale with thresholds for series.
- Axis Labels Positioning - The positioning of axis labels inside data plots is now easier.
- Improvements:
- Color palettes improvements.
- Labels background settings improvements.
- Axis markers improvements (new methods: background, padding, scaleRangeMode).
- Markers/Labels clipping improvements.
- anychart.ui.Table: new export methods ( saveAsXlsx, saveAsCsv).
- 3D Charts issues.
- Venn Chart: new token %selectedPointsSum.
- Pie Chart labels overlap improvements.
Fixes
- Tooltip issues in financial charts.
- Color functions anychart.color.darken and anychart.color.lighten issues.
- XML serialize scale ticks issue.
- Escape/Unescape symbols in XML serialization.
- Linear Gauge issues.
- Pointer’s z-Index in Circular Gauges issue.
- Heat map scroll inversion bug.
- Gauges scale calculations problems.
- Charts xScroller issues.